Spotlight: New Graphs and Charts Management
Updated: 03/15/2020
Article #: 14
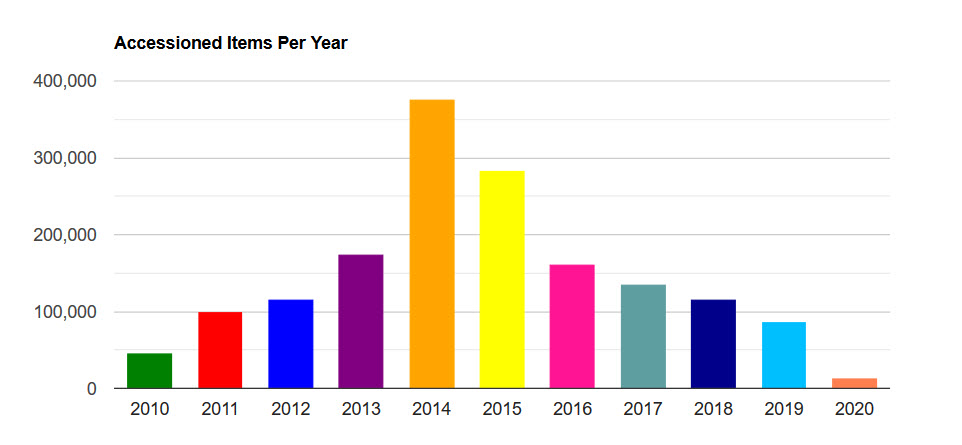
Two new charts are now available: Accessioned Items by Year and Accessioned Items by Collection and Month (for the Prior 6 Months).
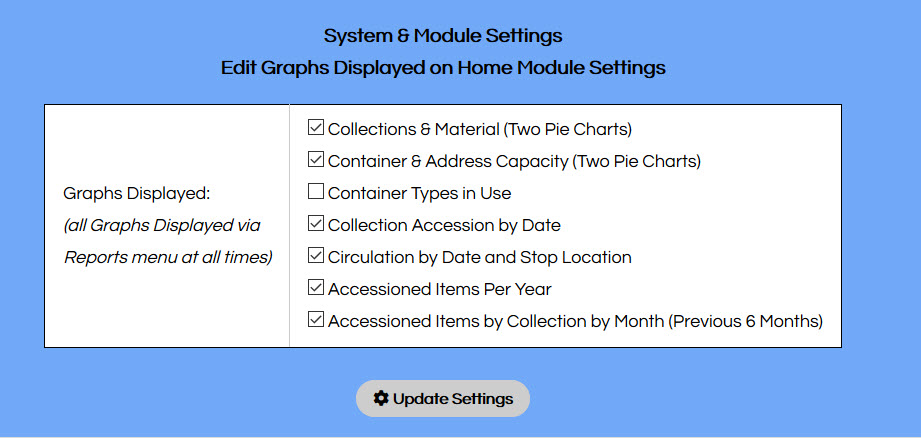
A dashboard of all graphs and charts available has been added to the Reports Module. In order to streamline the home screen as we continue to add more of this content, there is now an area in System and Module Settings to customize what graphs and charts display.
Reminder: all clients have an allotment of two custom graphs or charts - if there is a chart you would like created, please open a help ticket with the details.
Original Spotlight: March 2020
|
Rate this Topic:
|
|||
|